The Heriot-Watt Astrochemistry Research Group |
 |
Thermal desorption of H2O/CO ices
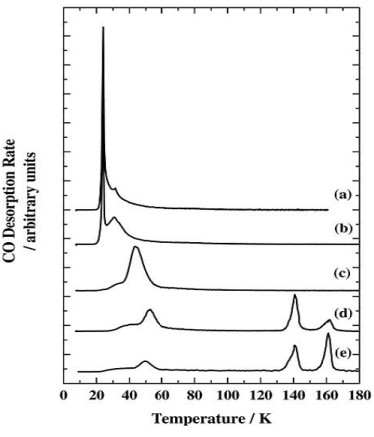
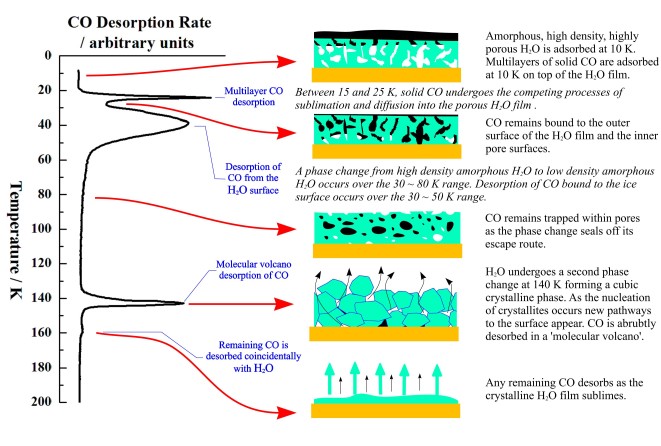
The two peaks at 140 K and 160 K occur at too high a temperature to be carbon monoxide desorbing from water ice, and the peaks are co-incident with a phase change in, and desorption of the water ice. New pathways to the surface are created during the phase change allowing desorption of some of the previously trapped CO in a desorption process called a "molecular volcano". A qualitatively similar TPD trace is seen when the water and carbon monoxide are dosed into the chamber at the same time, creating a mixed ice.
When the CO is deposited on top of a layer of water grown at 8 K, peaks due to both trapped CO and CO desorbing from the surface are seen. Since there is no physical barrier to CO desorption at the time of its deposition, there must be a structural change in the ice film which occurs before the CO finishes desorbing at ~60 K. This is confirmed by depositing a layer of CO on water ices grown at 30, 45 and 70 K. The fraction of trapped CO is reduced as the water deposition temperature is increased. Ice deposited at 8 K has a more porous structure than ice deposited at 120 K. The more porous ice is sometimes called Ihda and the less porous ice Ilda.
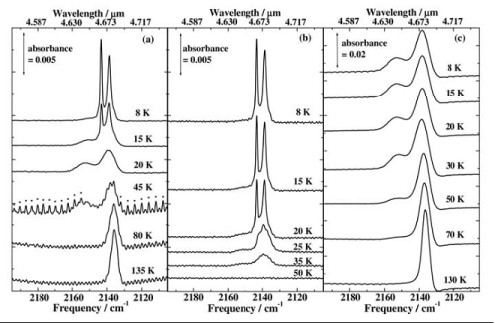
RAIRS experiments were also carried out on the H2O/CO ices, the results of which are shown in Fig. 2. Two sharp features are seen in the CO stretching region at 2139 cm-1 and 2142 cm-1 when CO is adsorbed onto water ice grown at 8 and 80 K. The peaks are attributed to the orthogonal and transverse vibrations of solid CO respectively, indicating that multilayers of solid CO are present. When the water and carbon monoxide are co-dosed, forming a mixed ice with ~5% CO, a broad peak is seen at 2139 cm-1 with a smaller feature at 2153 cm-1. The absence of the splitting in the co-deposited spectra indicates that the 2139 cm-1 and 2153 cm-1 features are due to carbon monoxide in a water matrix.
The ices were also warmed, held at the higher temperature for 5 minutes, and then cooled back down to 8 K to further investigate the effects of heating on the ices. When CO on Ihda was heated to 15 K the peaks due to multilayer CO decreased and had disappeared completely by 20 K. At the same time the growth of broad peaks at 2153 cm-1 and 2139 cm-1 can be seen, leading to the same two peak profile which is seen for co-deposited ices.
However, when the CO is adsorbed onto Ilda only a small reduction in the split peak is seen at 20 K and the 2153 cm-1 has only grown slightly. Evidence of multilayer CO does not disappear until the ices are annealed to 50 K, which is consistent with the TPD which shows desorption from Ihda is complete by 50 K.
For mixed ices the RAIRS shows evidence of CO being present up to ~130-135 K, which is in line with the TPD traces showing CO desorption at ~140 and 160 K.
This research is included in the following publications:
M. P. Collings, J. W. Dever, H. J. Fraser, M. R. S. McCoustra and D. A. Williams
Astrophysical Journal,
M. P. Collings, J. W. Dever, H. J. Fraser and M. R. S. McCoustra
Astrophysics and Spaces Science,